Visual Data Report- PowerBI
3
1 / 2
تفاصيل العمل
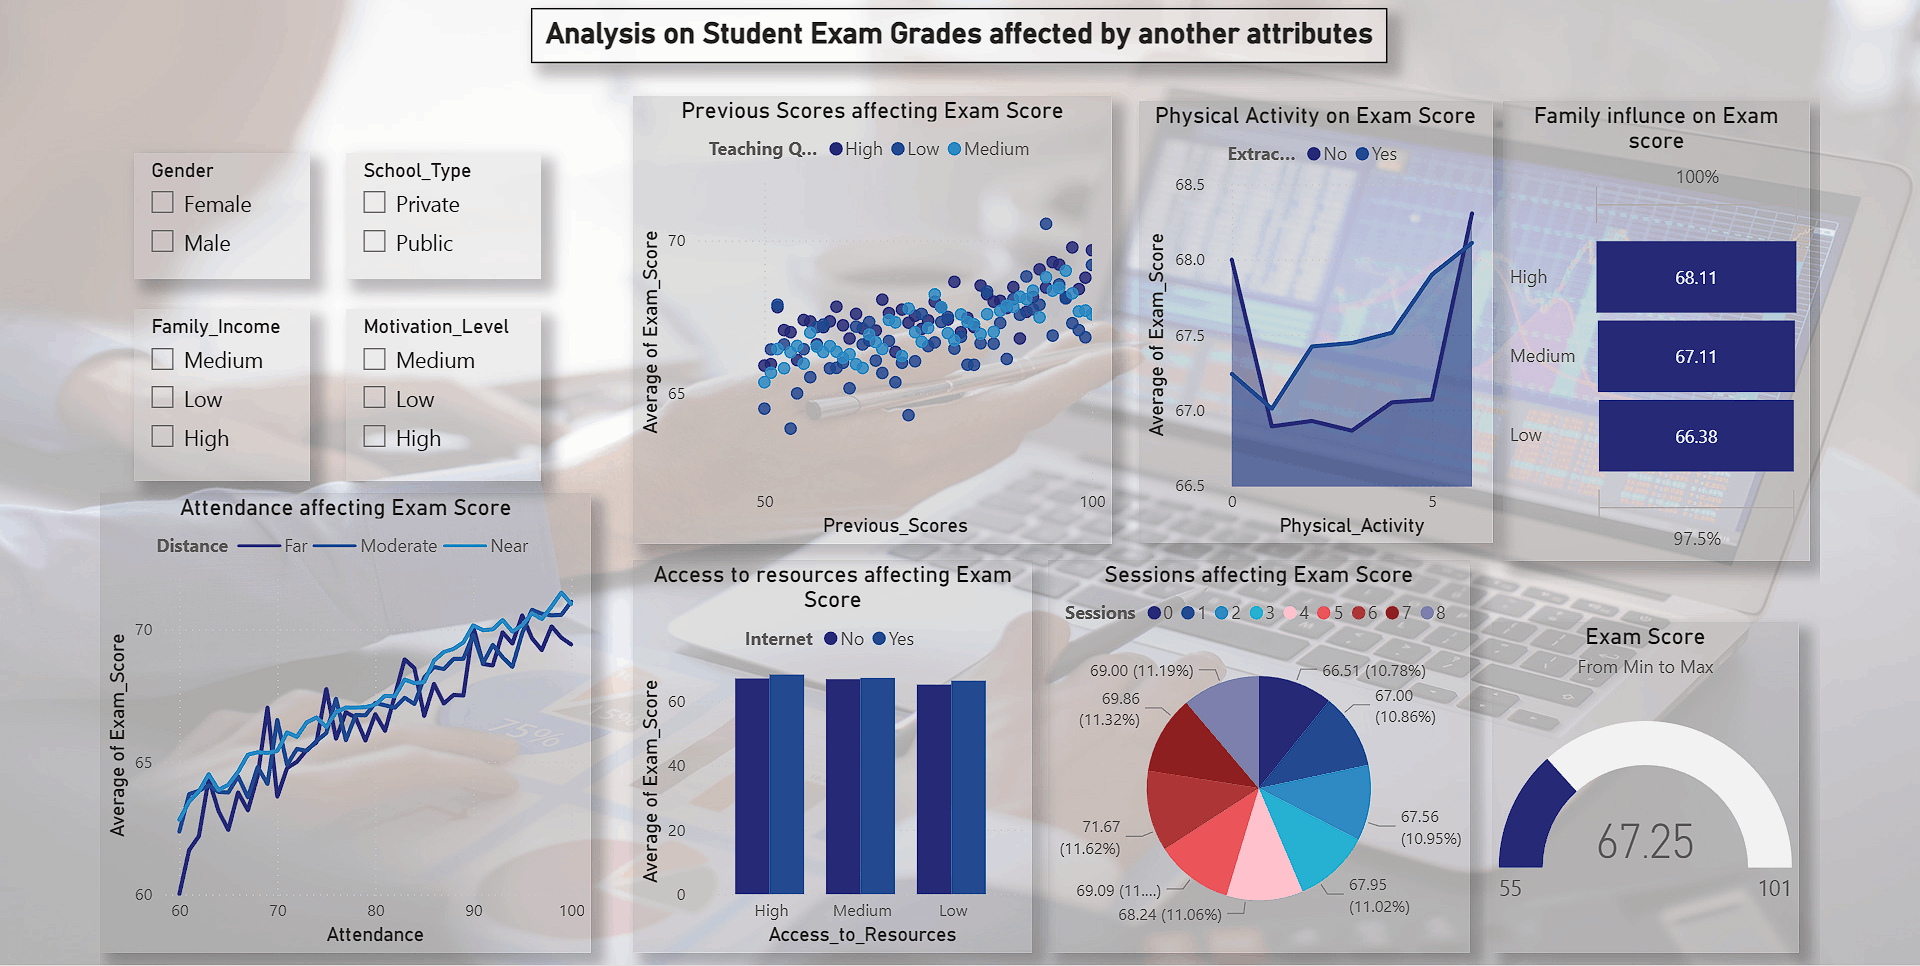
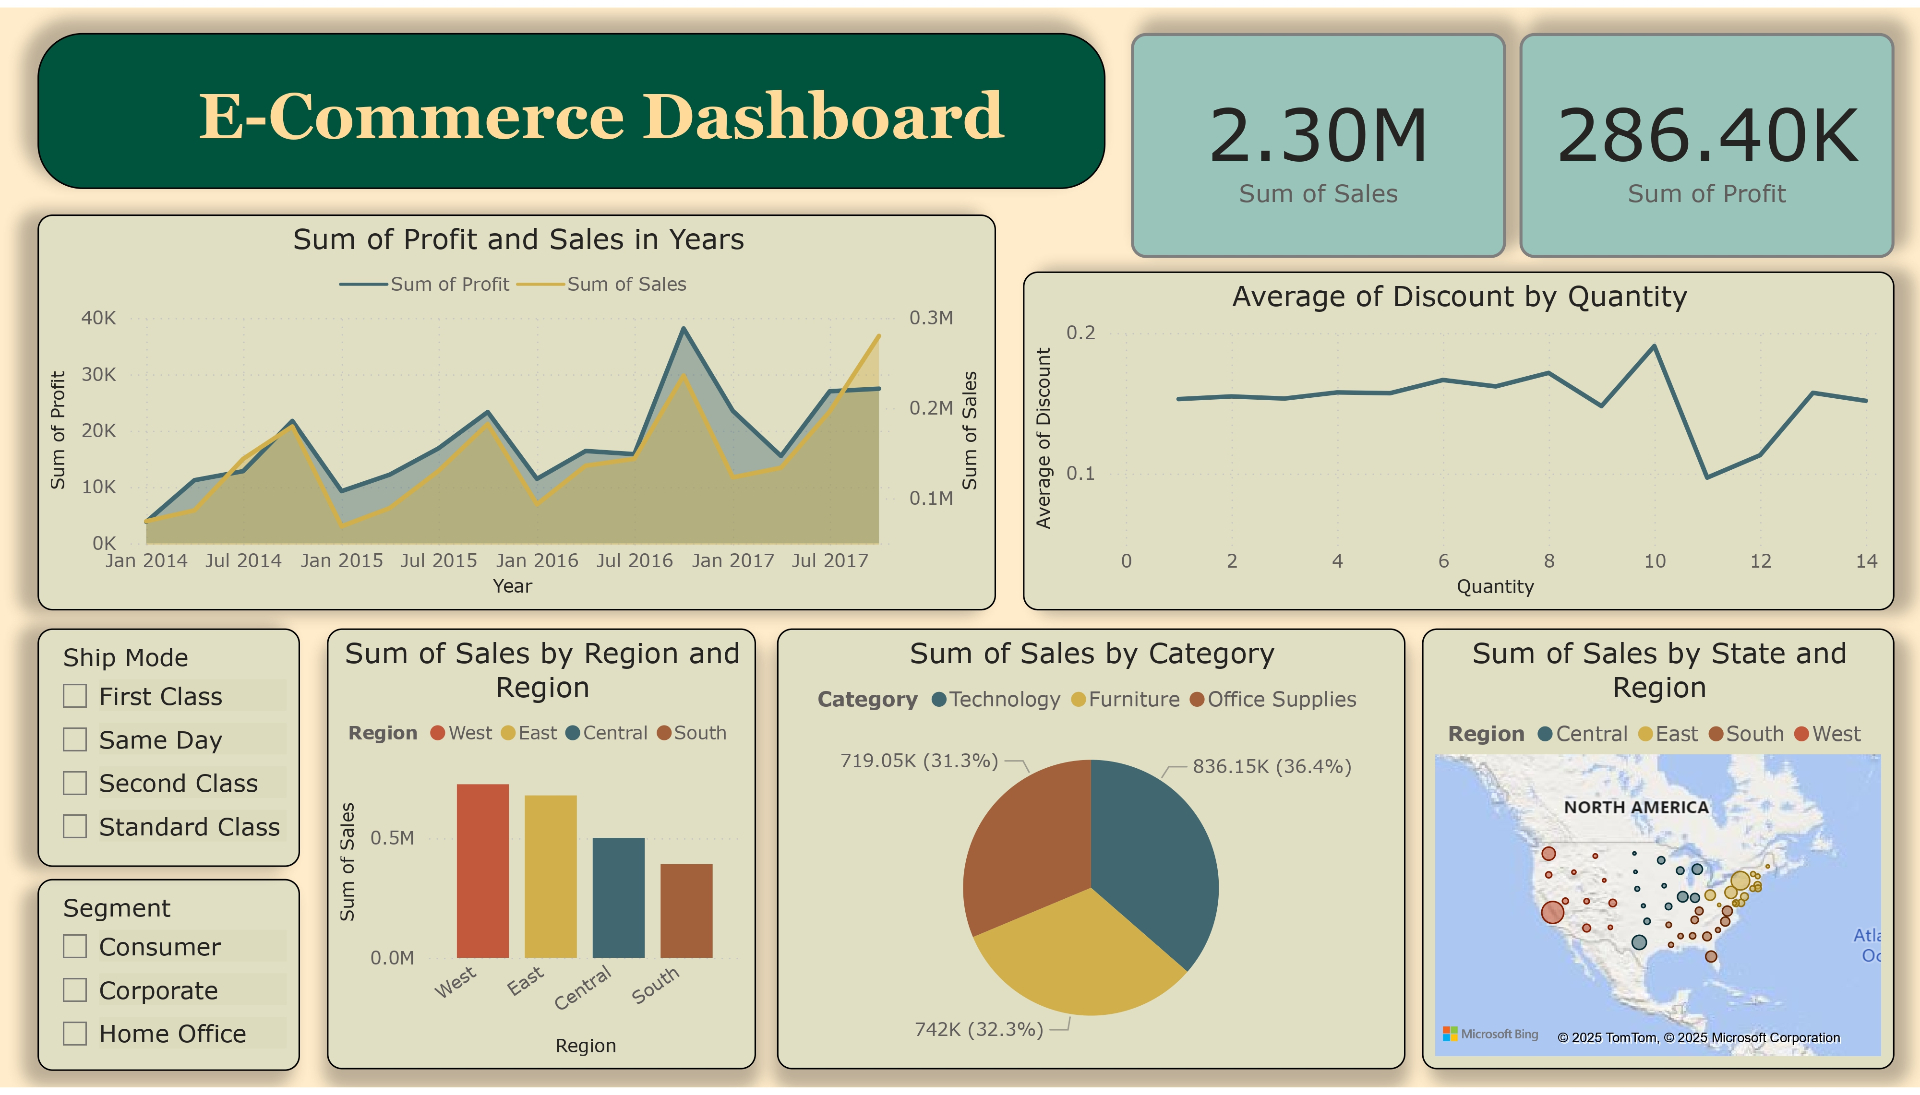
I turn your data into a visual report you can use in presentations or decisions. I create a visual report that shows patterns, trends and comparisons. I use Matplotlib and Seaborn. I include simple insights and short explanations. You get the notebook, the images and a PDF version. This works well for presentations, assignments and internal planning.
المهارات المستخدمة
Power BI
تحليل البيانات
Writing Reports
dashboard
لغة بايثون
تعليقات
لم يتم ترك أي تعليق حتى الأن
مشاركة معرض الأعمال
تعجبك !، قم بمشاركها